06 May Recent Real Estate Statistics for the Minneapolis and St. Paul Suburbs
Our government has an endless number of bureaus and departments many people don’t know about or know what they do. For instance, the Office of Policy Development and Research (PD&R) gathers Real Estate statistics. I have picked some of their most interesting findings to share. This info is somewhat dated being from 2018 but the findings still accurately represent the 2019 market.
The Suburbs of Minneapolis and St. Paul
These Real Estate statistics are specific to the suburbs surrounding Minneapolis and St. Paul. In 2017 inventory rose but don’t get too excited. The inventory rose from being very low to just low. PD&R explains, “A shortage of homes for sale— especially at the lower end of the market—has been a constraint on purchases for several years.” This trend is hitting single-family homes in the under 300,000 range especially hard. A lack of single-family homes is still a problem today.
Like unemployment rates, there is a tipping point where a lack of inventory harms the market. Low inventory keeps potential buyers from listing their homes and moving. Buyers are concerned they won’t find a new house if they sell. This wariness further perpetuates the low inventory. To drive the point home, the PD&R plainly states, “The inventory of homes available is not keeping up with the demand for homes.”
The South Metro Suburbs of Minneapolis and St. Paul
The following information is specific to the south metro, which is my team’s specialty. Pd&R show as of August 2018, new construction sales increased by 2.3% with the average sale price rising 3%. However, there was a 6% decrease in single-family new construction building permits issued. When it comes to existing homes, there were 8,200 sales, which was a 1.8% decrease from the year prior. But the good news is the average price for existing homes rose by nearly 9%! This is likely a result of the low inventory market conditions. Compared to other metropolitan areas, which includes surrounding suburbs, the average sales price in the Minneapolis-St. Paul is the highest in the Midwest.
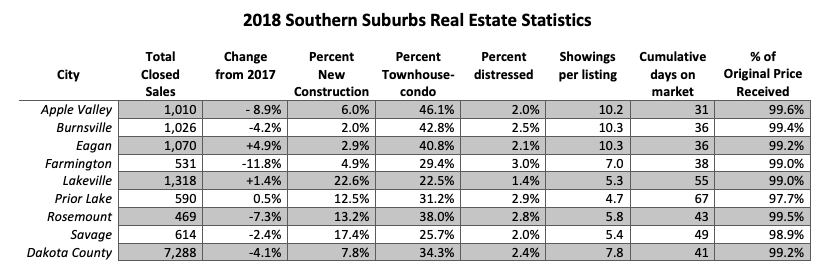
Minneapolis Area Realtors found 52 days is the average time on market for a single-family home in Minnesota. It also states sellers on average receive 98.9% of their listing price and have 14 showings before pending status. These are state-wide numbers. The chart I’ve made details the numbers we saw in the 8 southern suburbs my team usually works in. In addition, I added Dakota County where 6 out of 8 of these cities are located.
The percent of the listing price received is above average in every city but Lakeville and Prior Lake have lower than average days on the market. The south of the river suburbs Real Estate market is performing above average. However, it’s important to note we are still struggling with low inventory like the rest of Minnesota. If you would like more information you can visit the Office of Policy Development and Research. For your convenience, I’ve linked straight to their Minnesota housing data.

For more information please read some of my other blog posts including:
1 – The New OCR System Just Upgraded Self-Employed Mortgages
2 – 6 Positives and Negatives When Selling a Home in Spring Market
3 – 4 of the Most Common Closing Problems in Today’s Market
If you have any questions, please let me know, I’m always happy to help. You can give me a call at 612-889-6496 or send an email to [email protected].
Get a Virtual Price Opinion from Sheryl!


